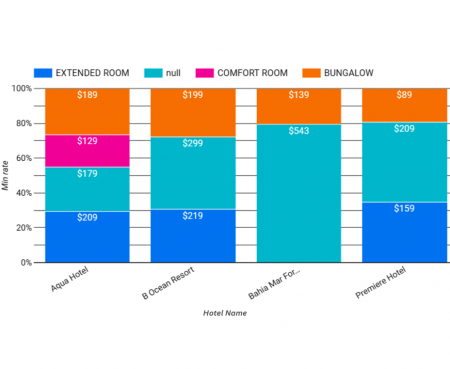
Minimum rate per hotel room type
This Stacked bar charts shows the minimum rate per hotel, per room type, for a given period of time.
Request a demo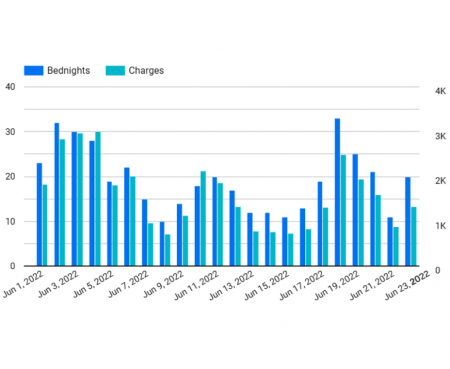
Booked hotel rooms vs revenue
This bar chart features two axis to compare different values of data. The data shown is from a hotel PMS, highlighting the number of booked rooms per day mapped with sold revenue.
Request a demo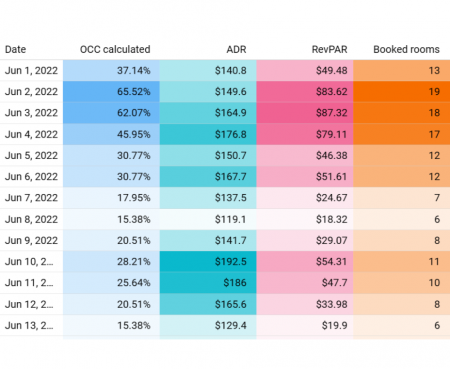
Hotel occupancy, average price, RevPAR & booked rooms
This Table chart combines and compares data from a hotel PMS, for occupancy, average price, RevPar and booked rooms per day.
Request a demo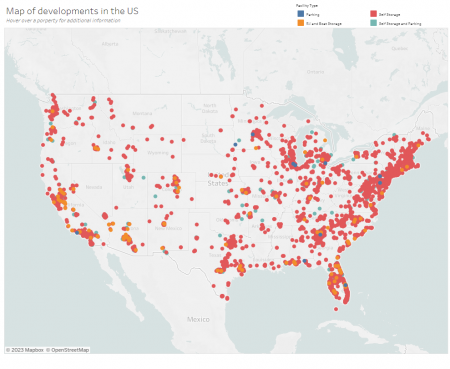
Location map of all available self-storage spaces
This map shows the location of all the available storage spaces in the US, divided by facility type. Additional information can be found by clicking on the location.
Request a demo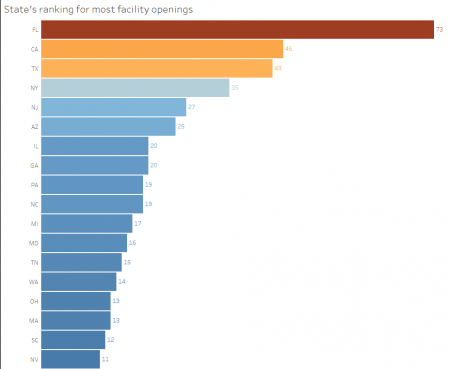
New self-storage openings per state
This chart shows the ranking of US States with the most storage spaces facility openings in the next 12 months.
Request a demo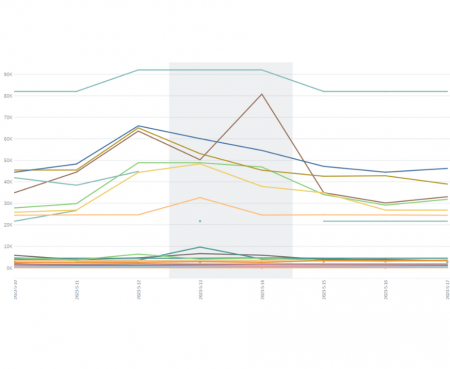
Air Fare Evolution
This chart shows the evolution of flight prices(min, avg or max, selected by the user) for the same route, divided by airline over a time horizon selected by the user.
Request a demo